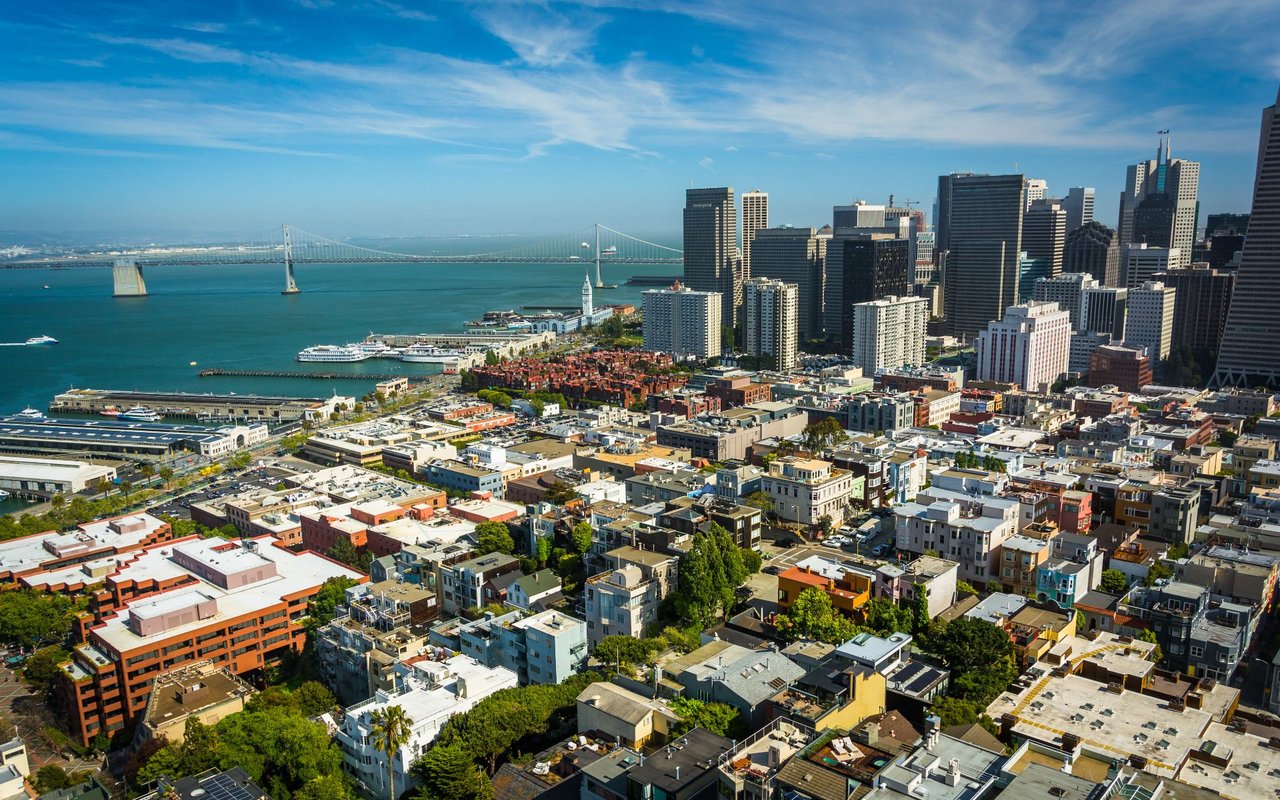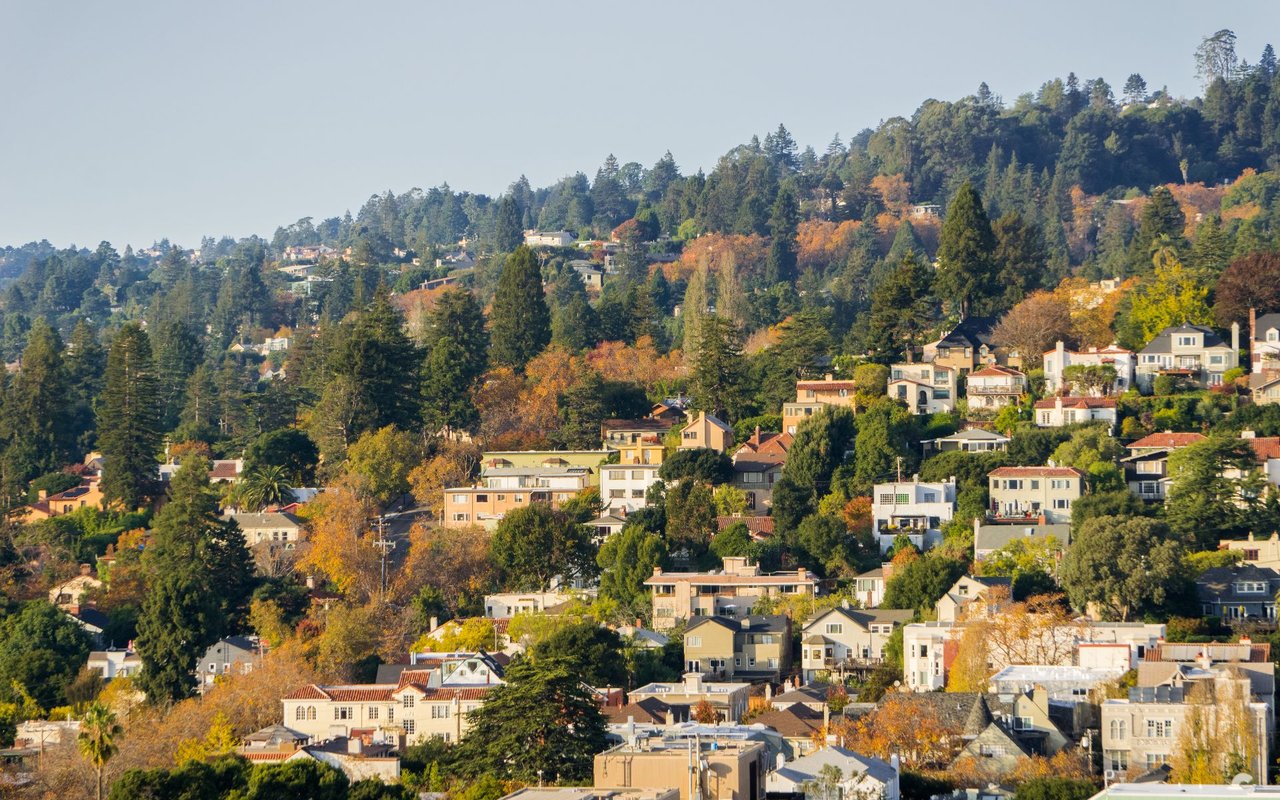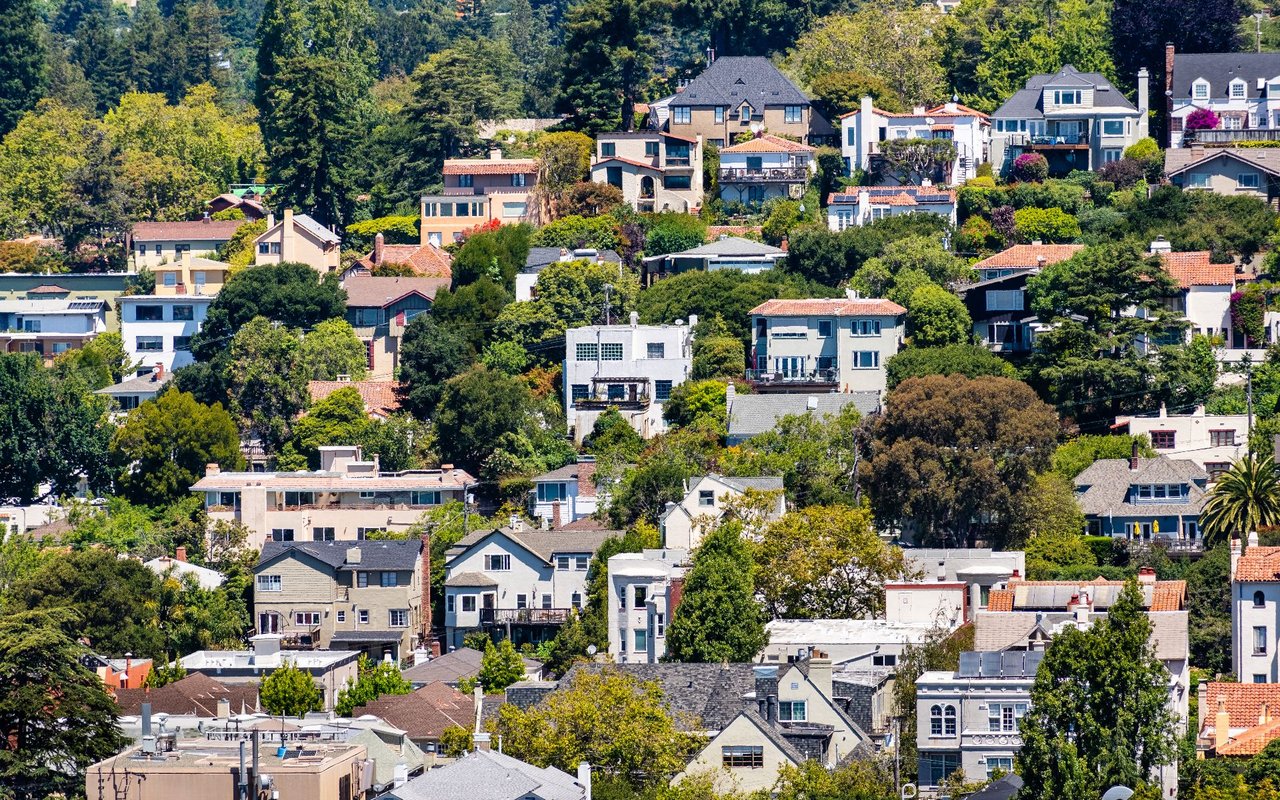
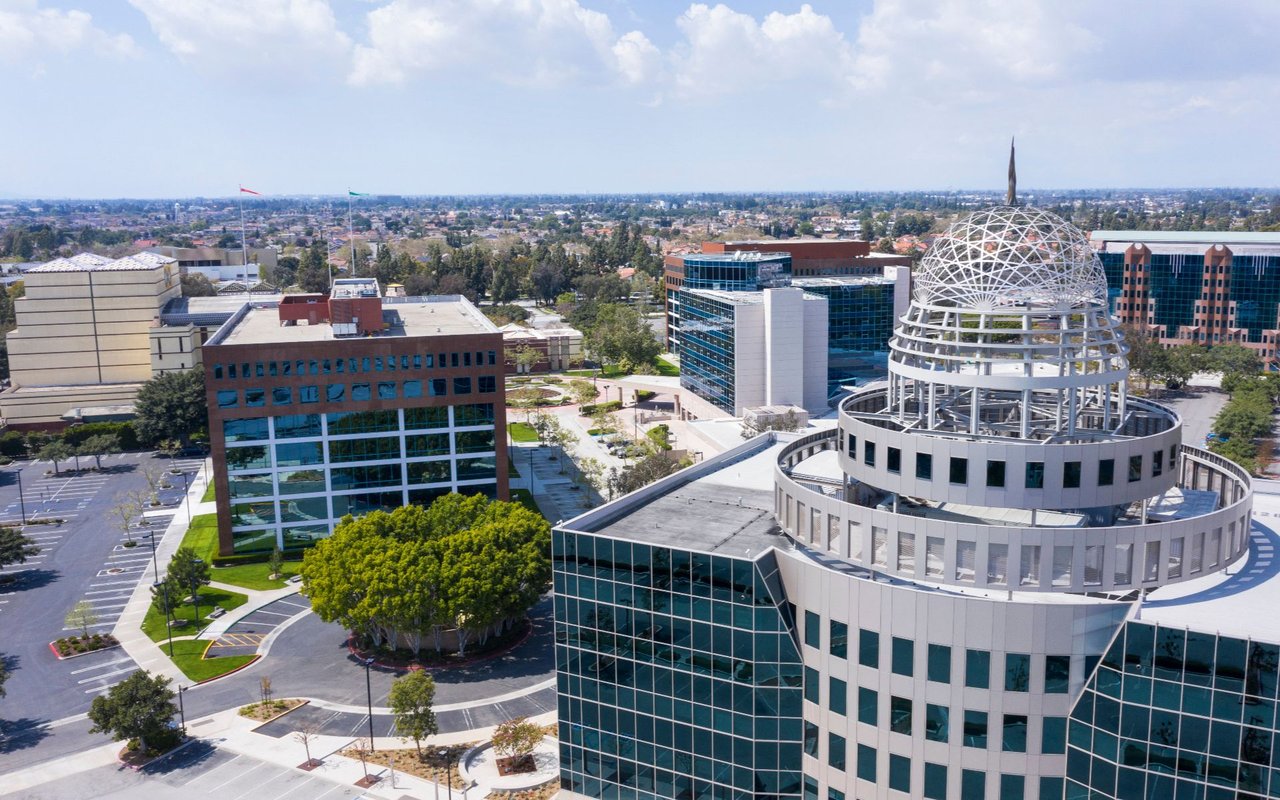
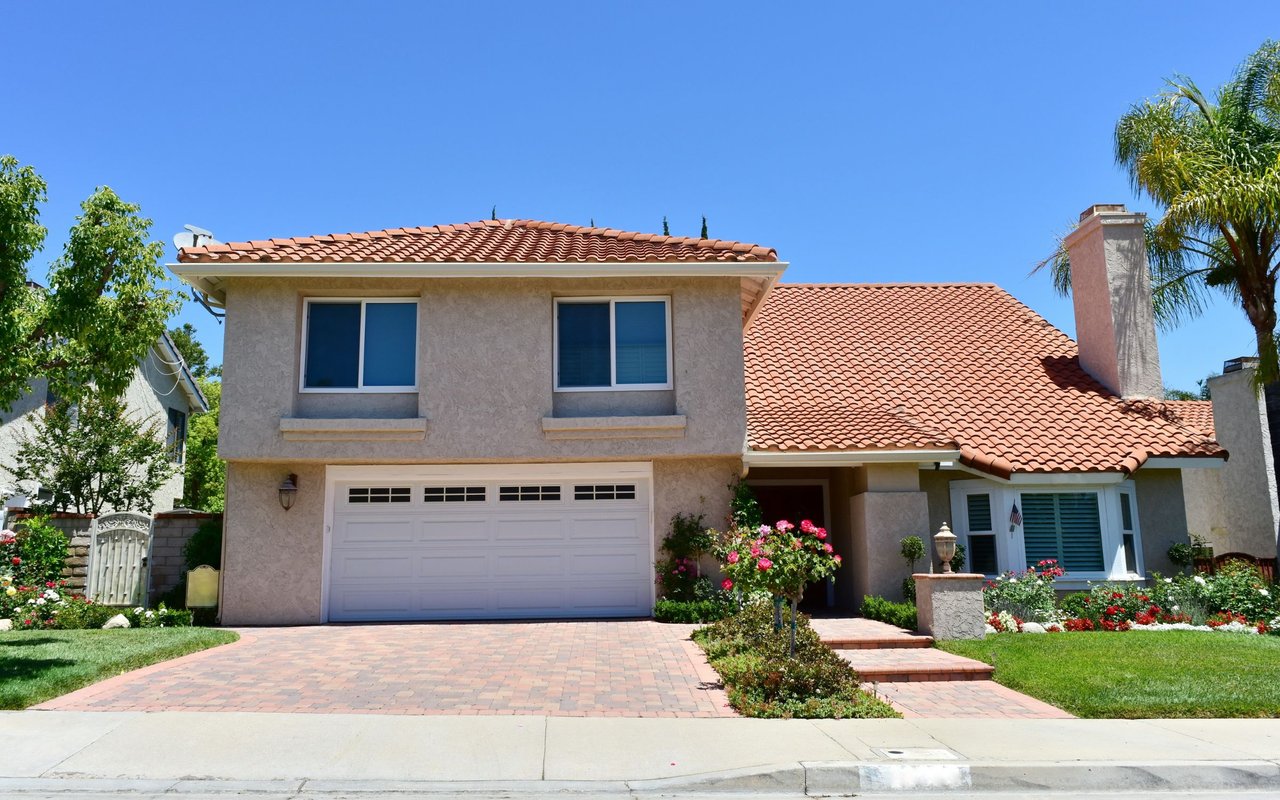
El Cerrito is a city in Contra Costa County, California, United States, and forms part of the San Francisco Bay Area. It has a population of 23,549 according to the 2010 census. El Cerrito was founded by refugees from the 1906 San Francisco earthquake. It was incorporated in 1917 as a village with 1500 residents. As of the census in 2000, there were 23,171 people, 10,208 households and 5971 families in the city. The top 20 employers in the city, according to the 2013 Comprehensive Annual Financial Report, include such entities as the West Contra Costa Unified School District, City of El Cerrito, Lucky Stores, Pastime ACE Hardware, and Honda of El Cerrito.
26,229 people live in El Cerrito, where the median age is 42.5 and the average individual income is $72,917. Data provided by the U.S. Census Bureau.
Total Population
Median Age
Population Density
Average individual Income
There's plenty to do around El Cerrito, including shopping, dining, nightlife, parks, and more. Data provided by Walk Score and Yelp.
Explore popular things to do in the area, including Golden 7 Food Store, Le Marche, and 19RalphStreet.
| Name | Category | Distance | Reviews |
Ratings by
Yelp
|
|---|---|---|---|---|
| Dining · $$ | 3.51 miles | 9 reviews | 5/5 stars | |
| Shopping | 4.88 miles | 11 reviews | 5/5 stars | |
| Beauty | 3.97 miles | 13 reviews | 5/5 stars | |
| Beauty | 1.51 miles | 17 reviews | 5/5 stars | |
|
|
||||
|
|
||||
|
|
||||
|
|
||||
|
|
||||
|
|
El Cerrito has 10,923 households, with an average household size of 2.39. Data provided by the U.S. Census Bureau. Here’s what the people living in El Cerrito do for work — and how long it takes them to get there. Data provided by the U.S. Census Bureau. 26,229 people call El Cerrito home. The population density is 6,057 and the largest age group is Data provided by the U.S. Census Bureau.
Total Population
Population Density Population Density This is the number of people per square mile in a neighborhood.
Median Age
Men vs Women
Population by Age Group
0-9 Years
10-17 Years
18-24 Years
25-64 Years
65-74 Years
75+ Years
Education Level
Total Households
Average Household Size
Average individual Income
Households with Children
With Children:
Without Children:
Blue vs White Collar Workers
Blue Collar:
White Collar:
6211 Shattuck Ave Berkeley CA 94709
6211 Shattuck Ave Berkeley CA 94709